A colleague of mine has just returned from the AWS re:Invent and brought in all the excitement about new AWS technologies. So I went on to watching the released videos of the talks. One of the first technical ones I have set on watching was Performance Tuning Amazon EC2 Instances by Brendan Gregg of Netflix. From Brendan's talk I have learnt about Lightweight Java Profiler (LJP) and visualizing stack traces with Flame Graphs.
I'm quite 'obsessed' with monitoring and performance tuning based on it.
I'm quite 'obsessed' with monitoring and performance tuning based on it.
Monitoring your applications is definitely the way to:
1. Get numbers on performance inside your company, spread them and let people talk stories about them.
2. Tune the system in where you see the bottleneck and measure again.
In this post I would like to share a shell script that will produce a colourful and interactive flame graph out of a stack trace of your java application. This may be useful in a variety of ways, starting from an impressive graph for you slides to making informed tuning of your code / system.
Components to build / install
This was run on ubuntu 12.04 LTS.
Checkout the Lightweight Java Profiler project source code and build it:
svn checkout \
http://lightweight-java-profiler.googlecode.com/svn/trunk/ \
lightweight-java-profiler-read-only
cd lightweight-java-profiler-read-only/
make BITS=64 all
(omit the BITS parameter if you want to build for 32 bit platform).
As a result of successful compilation you will have a liblagent.so binary that will be used to configure your java process.
git clone https://github.com/brendangregg/FlameGraph.git
You don't need to build anything, it is a collection of shell / perl scripts that will do the magic.
Configuring the LJP agent on your java process
Next step is to configure the LJP agent to report stats from your java process. I have picked a Solr instance running under jetty. Here is how I have configured it in my Solr startup script:
java \
-agentpath:/.../lightweight-java-profiler-read-only/\
build-64/liblagent.so \
-Dsolr.solr.home=cores start.jar
Executing the script should start the Solr instance normally and will be logging stack trace to traces.txt
Generating a Flame graph
In order to produce a flame graph out of the LJP stack trace you will need to perform the following:
1. Convert LJP stack trace into a collapsed form that FlameGraph understands.
2. Call flamegraph.pl tool on the collapsed stack trace and produce the svg file.
I have written a shell script that will do this for you.
#!/bin/sh

# change this variable to point to your FlameGraph directory
FLAME_GRAPH_HOME=/home/dmitry/tools/FlameGraph

LJP_TRACES_FILE=${1}
FILENAME=$(basename $LJP_TRACES_FILE)

JLP_TRACES_FILE_COLLAPSED=\
$(dirname $LJP_TRACES_FILE)\
       /${FILENAME%.*}_collapsed.${FILENAME##*.}
FLAME_GRAPH=\
       $(dirname $LJP_TRACES_FILE)/${FILENAME%.*}.svg

# collapse the LJP stack trace
$FLAME_GRAPH_HOME/stackcollapse-ljp.awk $LJP_TRACES_FILE > \
    $JLP_TRACES_FILE_COLLAPSED

# create a flame graph
$FLAME_GRAPH_HOME/flamegraph.pl $JLP_TRACES_FILE_COLLAPSED > \
$FLAME_GRAPH
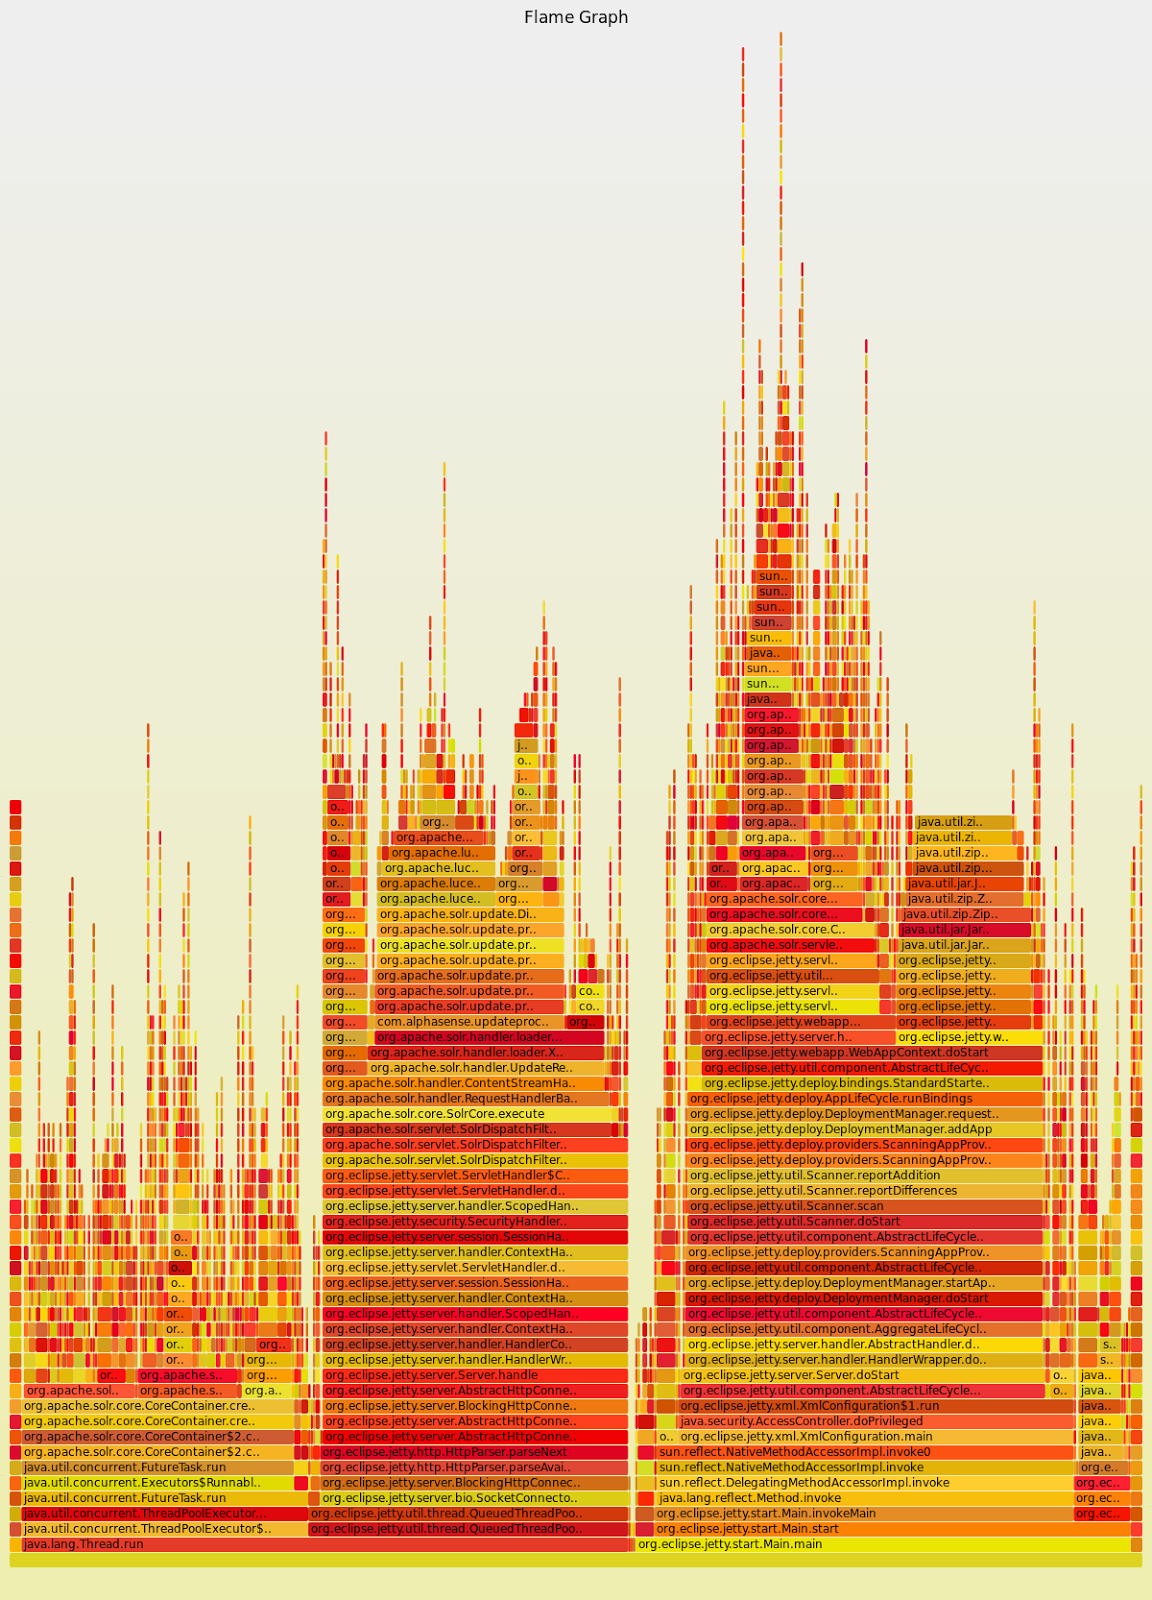
And here is the flame graph of my Solr instance under the indexing load.
You could interpret this diagram bottom-up: the lowest level is entry point class that starts the application. Then we see that CPU-wise two methods are taking the most of the time: org.eclipse.jetty.start.Main.main and java.lang.Thread.run.
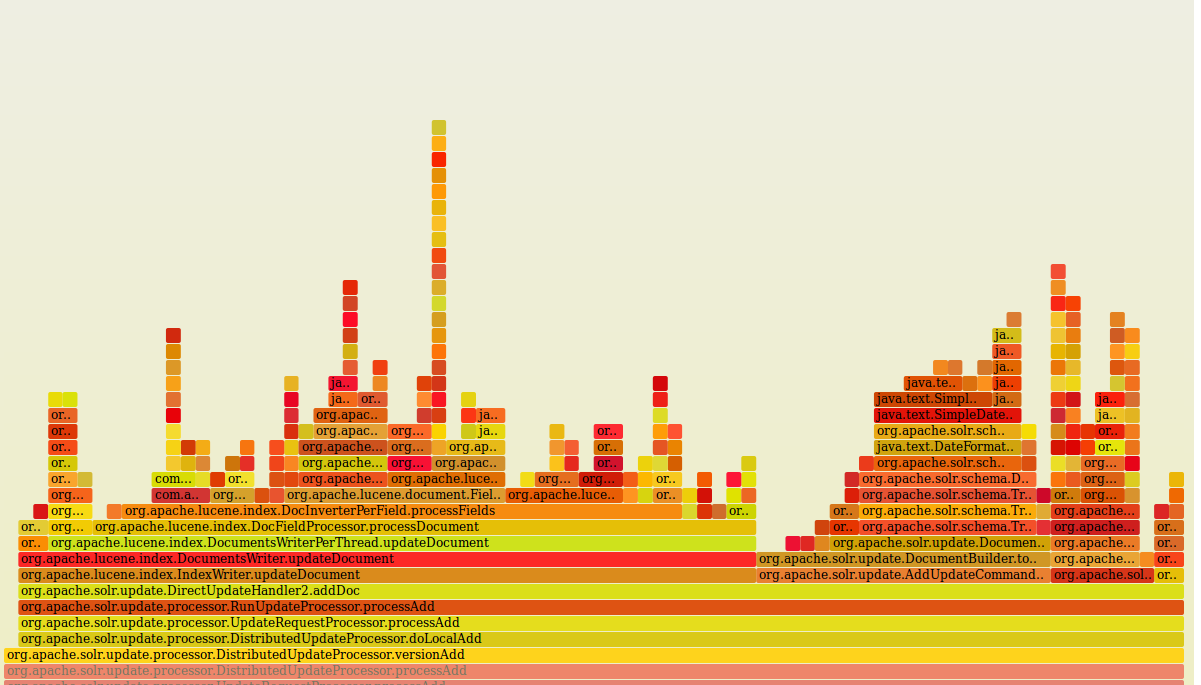
This svg diagram is in fact an interactive one: load it in the browser and click on the rectangles with methods you would like to explore more. I have clicked on the
org.apache.solr.update.processor.UpdateRequestProcessor.processAdd rectangle and drilled down to it:
org.apache.solr.update.processor.UpdateRequestProcessor.processAdd rectangle and drilled down to it:
It is this easy to setup a CPU performance check for your java program. Remember to monitor before tuning your code and wear a helmet.


