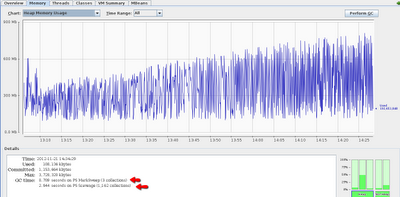
In my Java experience it has been somewhat unobvious how to jump from monitoring GC and fancy memory graphs with tools like jconsole to actually improving your code.
The ingredient I was missing apparently before was jmap that is part of JDK.
What the tool does is that it allows you to attach to a live java process by process id (pid) and output the histogram of its objects. Here is how it works:
jmap -histo 22170 > histo_22170.log
In the example, 22170 is the java process pid and command line option -histo makes jmap to output a histogram of objects. One nice thing about jmap is that it allows you build an object histogram on JVM OutOfMemory crash (see some details here).
The first lines of the histo_22170.log look like this, before some bug fixing has been done to the code (more on this in a moment):
num #instances #bytes class name
----------------------------------------------
1: 88210219 2943436216 [B
2: 5198407 455421864 [[B
3: 5162015 123888360 com.mysql.jdbc.ByteArrayRow
4: 2005702 95264296 [C
5: 2006883 64220256 java.lang.String
6: 37819 53525280 [I
7: 309332 44543808 com.mysql.jdbc.Field
8: 923280 36931200 java.util.TreeMap$Entry
9: 18744 25864528 [Ljava.lang.Object;
10: 471843 15098976 java.util.HashMap$Entry
11: 36577 5195248 [Ljava.util.HashMap$Entry;
12: 18196 4512608 com.mysql.jdbc.JDBC4PreparedStatement
13: 18196 3202496 com.mysql.jdbc.JDBC4ResultSet
14: 54308 2606784 java.util.TreeMap
15: 12809 1903312
16: 36571 1755408 java.util.HashMap
17: 12809 1750136
19: 18196 1164544 com.mysql.jdbc.PreparedStatement$ParseInfo
I have marked the relevant parts of the histogram with the bold font. The java process was doing some heavy-duty task for thousands of files and talking to the MySQL DB in a loop to load some meta-information for each of the file. The process was given 4GB max heap size and was not properly finishing, producing OutOfMemory error that in turn crashed the JVM.
The code snippet that was producing this looked like this:
PreparedStatement sqlStatement = sqlConnection.prepareStatement(
                          "SELECT * FROM SOME_TBL WHERE SOME_ID=?");
for(int i = 0; i < some_number_less_than_100; i++) {
    sqlStatement.setString(1, companyIds.get(i));
    ResultSet sqlResult = sqlStatement.executeQuery();
    if (sqlResult != null) {
     while (sqlResult.next()) {
        // do some processing of the query results here
     }
    }
}
Intuitively by now you should feel that something is wrong with the code around the JDBC object management.
Let's have a look on the bolded parts from the top of the object histogram. Apparently, the trending JDBC related objects are com.mysql.jdbc.Field with 309332 instances, com.mysql.jdbc.JDBC4PreparedStatement with 18196 instances and com.mysql.jdbc.JDBC4ResultSet with 18196 instances. Two latter objects have exactly same number of instances and that is reflected in our code, where both objects are re-created in a loop. The visual monitoring tool jconsole was showing constant RAM usage growth and Eden Heap Space being saturated with lots of young objects, while the Survivor Heap Space was not trending at all.
What's missing is releasing the JDBC resources, by calling close() methods on both PreparedStatement and ResultSet.
So let's correct the code:
PreparedStatement sqlStatement = sqlConnection.prepareStatement(
                           "SELECT * FROM SOME_TBL WHERE SOME_ID=?");
for(int i = 0; i < some_number_less_than_100; i++) {
    sqlStatement.setString(1, companyIds.get(i));
    ResultSet sqlResult = sqlStatement.executeQuery();
    if (sqlResult != null) {
     while (sqlResult.next()) {
        // do some processing of query results here
     }
     // missing lines added
     sqlResult.close();
}
sqlStatement.close();
After the two missing statements have been added (sqlResult.close() and sqlStatement.close()), the DB resources started to release properly and the original process began to work properly, without big spikes in RAM usage. The JDBC related objects have also disappeared from the top of the histogram:
num #instances #bytes class name
----------------------------------------------
1: 1301417 66169256 [C
2: 1333656 42676992 java.lang.String
3: 158410 29981072 [I
4: 382702 12246464 java.util.HashMap$Entry
5: 116080 5668216 [B
6: 230584 5534016 java.lang.StringBuffer
7: 56760 3632640 java.util.regex.Matcher
8: 18320 2620552
9: 18320 2501360
10: 588 2187960 [Ljava.util.HashMap$Entry;
11: 1460 1733744
12: 33570 1523672
13: 19495 1247680 java.util.regex.Pattern
14: 19729 1201136 [Ljava.lang.Object;
15: 1460 1130688
16: 19477 1090712 [Ljava.util.regex.Pattern$GroupHead;
17: 1312 1080992
18: 19096 614976 [Ljava.lang.String;
19: 18642 596544 java.util.RandomAccessSubList
20: 18642 596544 java.util.AbstractList$ListItr
Now the process is happily completing with reasonable RAM usage:
 |
| Click the image to make it bigger |
The diagram shows that Eden Heap Space became much more free of young objects and the Survivor Heap Space gets utilized more. See here, if you want more details on various pools of Heap and Non-Heap memory.
Interestingly enough, this bug was hiding for months in the code base and only manifested itself once more data had to be processed. This made the process to run longer and thus reach and overflow the allocated RAM bounds.
This trivial example shows the importance of monitoring your heavy (and not so) java processes.
Happy monitoring!